
The IWW has a member retention problem. The following graph comes from an article FW Simon recently wrote and the IW published called “Our Goals, Our Methods, and Our Efficacy.” It demonstrates the number of initiations into the IWW versus how many members remained from those years.
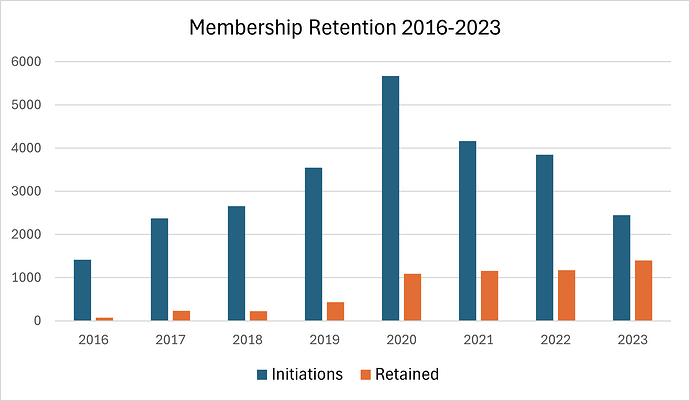
The article blames onboarding, failure to engage members, and failure to organize at our workplaces for our retention woes, at least partially. Making sure we onboard and engage members and organize at our workplaces are all good ideas. The article draws from a number of sources, but the claims about onboarding and engagement largely come from 2023’s Exit Survey. The 2023 Exit Survey was not very well set up or conducted and as a result, the data it gives us is spurious. The response rates were low; there’s no reason to believe the respondents represent the larger population; the questions are weighted; and possible responses are not sufficiently distinct and/or meaningful. We need more and better data. If we can collect/build better data, then we can understand who joins the union, who leaves the union, and why. If we know why wobblies leave the union, then we can figure out what we can do to retain members and continue building decentralized, bottom-up, power at the workplace. After that, the sky is the limit.
Representativeness
Few departing wobs responded to the survey. That affects the study’s external validity, whether researchers can generalize the findings out to a larger population. Researchers gave the survey to everyone who formally resigned from the union. They also included it in the standard outreach email to members who fell inactive and might have been fading out, which is how they define informal resignation. 3033 people left the IWW in 2023. 275 formally resigned and 2758 informally resigned. Only 127 responded total. That comes out to about 4% of 2023’s departing wobblies. 4 cannot represent 100. In reality, nothing and no one ever completely represents anything else. So, even 99 cannot represent 100. But, it’s closer; it’s better; it’s more likely to be valid.
Fractional studies could perhaps represent a larger population well enough if we conduct them accordingly. To do that, we need to know demographic information. The representative and the represented need to be the same kind of being. Only 4% of departing wobs returned the survey. We have no reason to believe that those who responded represent the larger population. By accepting all the surveys at face value, we select a sample based on behavior. Behaviors and attitudes are deeply connected to categories such as race, ethnicity, language, education level, income, culture, and so on. Those who responded may share traits and characteristics and may differ from those who did not respond. We can salvage a study with a partial response rate by selecting a representative sample from within the completed surveys. To do this, we need participants’ demographic information and should collect that at the end of the survey. We also need demographic information about the larger population for comparison, which the survey and research committee was collecting in 2025.
We need valid data but we also need reliable data. Reliability means the testing instrument produces consistent results (within a margin of error). To determine if data is reliable, we need to test multiple times. We can’t expect departing wobblies to fill out multiple surveys and even if they did, it would probably wreck the study’s internal validity since becoming familiar with a study can affect how we respond to it. Personality tests are a good example of this. But, we can conduct the study continuously over time. If we use the same instrument (the same survey) year after year, we can compare the data from one year to the next and at least make some reasonable claims about change over time. This allows us to then study if our interventions have any impact.
High quality studies are both valid and reliable. They account for these kinds of problems through large and representative samples that account for impactful characteristics and through repeated testing. We need surveys that go out to all departing wobs and mark their demographics so we can have a representative selection even with partial responses. We must continue doing this over time. Without these, our results are untrustworthy and may mislead later researchers using our data. We don’t want to be the blind leading the blind.
Questions and Answers
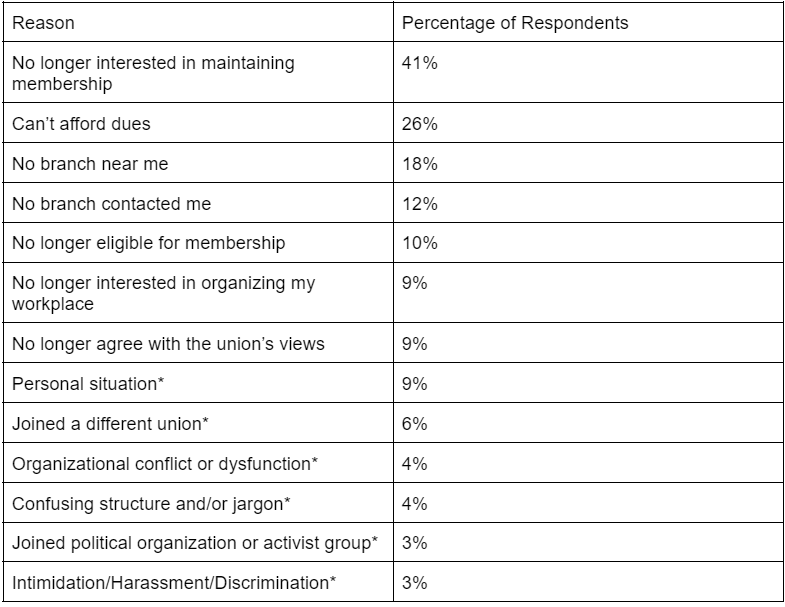
So far, my arguments assumed that respondents respond honestly and accurately, which is never certain, but is especially unlikely given the survey’s questions and answer options. The survey’s first question was “Why did you quit the IWW?” This table shows the responses.
“Quit” carries a heavy burden and creates problems. American rhetorical theorist Kenneth Burke tells us in Permanence and Change that neutral vocabularies do not exist. All words carry weight. If you don’t believe me, ask yourself: do you want to be a quitter? I highly doubt it. Even if we individually understand that quitting is alright sometimes, American culture tends to tell people that quitting is shameful. This starts very young. So, we carry around this cultural-linguistic baggage that crops up whenever we hear or see the word “quit.” This matters because shaming respondents can impact the results.
The most common response was “no longer interested in maintaining membership.” This may have been the most common reply because the question made respondents feel ashamed. It is difficult to answer honestly or accurately when stressed. This answer gives respondents an easy out, which they’d be more likely to take because they’re under stress and want to get out of the situation. We subject children to similar situations and see them behave similarly. Many times as a child, people would shame me for behaving in some way and ask why I did it. My only reply was “I don’t know” or “because.” There is no difference here. I suspect others have similar experiences.
We should remove this answer because it measures nothing and adds nothing to our analysis. It is not a real answer. It’s like asking someone “why did you stop going to work” and them replying “because I wasn’t interested in going anymore.” How useful. Questions and answers need to measure something. We should remove this answer because it measures nothing and provides no value to our analysis.
The survey supplies double barreled answers. When we remove “no longer interested in maintaining membership” from the running, “can’t afford dues” becomes the primary reason respondents claim they left the union. “Can’t afford” can mean multiple things. It can mean that someone lacks the means, they cannot, and it can mean someone lacks the motivation, they will not. These are different problems and require different solutions. We should separate this response into two alternatives, one that measures those who can’t afford dues and those who won’t afford dues.
Lastly, the survey double dips. It lets respondents reply with both “no branch near me” and “no branch contacted me.” We’re measuring the same thing twice. Or, at least they’re measuring overlapping things. A branch cannot contact you if no branch exists. To really determine why people leave, we need to disentangle the questions. We should change “no branch contacted me” to “branch near me, but branch did not contact me.”
Recommendations
Validity: Send exit surveys to everyone who leaves the union, formally or informally, and ask for demographic data at the end. Select a representative sample based on respondents’ demographic data and the union’s larger demographics. Giving away personal data frightens people, but that info is crucial to figuring out who joins, who stays, who leaves, and why. Place demographic questions at the end of the survey, consider telling participants honestly why it matters, and anonymizing their responses. Asking those questions early can frighten people and prevent them from answering the survey at all. Participants are more likely to answer them if they’re at the end because they already committed the time.
Reliability: conduct exit surveys continuously and release yearly results so that we can measure change over time. This insulates our data somewhat and helps us determine if our actions have any impact and so adjust course.
Develop better questions and better responses. First determine what we want to know. Ensure that our questions don’t unduly affect responses. Our questions will always affect responses, but there is a difference between “why did you quit,” “why are you leaving,” and “why are you withdrawing?” Questions and answers must be distinct and meaningful, not double-barreled or double dipping.
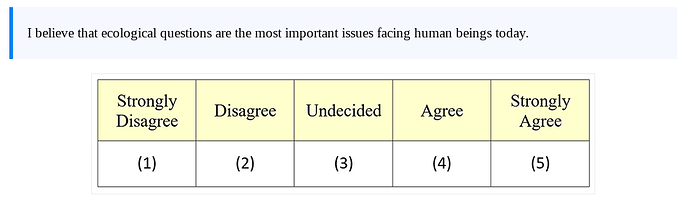
Perhaps use a Likert survey to collect data. Likert surveys quantify and measure attitudes and opinions across respondents. They help us measure how well we’re doing across the board and identify areas to improve. Here is an example:
Conclusion
I am not an empirical scientist. I took one PhD class on empirical research methods, so take what I say with a grain of salt. But, you don’t have to be Doc Brown to see my point. Results result from the questions we ask and the lenses we apply. When our questions have flaws, and the available responses have flaws, and when the way we conduct the study has flaws, we can’t be surprised to find flawed results. I cast no blame because it won’t help us and it doesn’t really matter. I merely want us to continue growing as a union, to produce more and better organizers who can organize more workplaces, more completely, and with greater and greater results so that we can realize true liberty, equality, and solidarity more fully with each passing day. To do that, we need to discover who joins the union, who stays, who leaves, and why. And to do that, we need more and better data, produced by more and better studies. Only by doing this can we accurately determine where we are and bridge the gap between where we are and where we want to be.
Disclaimer: The opinions expressed in this article are those of the author. They do not purport to represent that of the IWW or Industrial Worker as a whole.
This article originally appeared in the 2026 Summer edition of Industrial Worker.